Blog 8: Validating Success
- Thy Nguyen
- Apr 13, 2024
- 3 min read

The latest update on Blog 7 noted that all the necessary tools for the validation test were acquired on March 26, 2024. Following this, the team initiated the validation test on March 29, 2024.
As intended, the validation was completed within a day's work. From the test results, the team learned that the designed device successfully reduced the transient time to achieve the target temperature by 20% and increased the airflow capacity by +150 CFM. Moreover, it decreased the airflow capacity by -30 CFM while maintaining a noise level below 60 dB throughout the entire test.
During the week of April 1st, the focus was on analyzing and graphing the results obtained from the validation process. This visual representation was aimed at assisting in the preparation of the Technical Report and Presentation by formatting the data into graphs that help viewers visualize the relative performance of our device, which will be seen below.
Our device successfully achieved the objective of reducing the time required for a singular room to reach 72°F, initially at 78°F, by enhancing its cooling capacity. Prior to installation, the airflow was measured at 153.8 CFM, which significantly increased to 301.8 CFM post-installation, resulting in a successful validation. Cooling time saw a notable improvement, decreasing from 45 minutes and 30 seconds to 36 minutes, marking a reduction of 9 minutes and 30 seconds, approximately 21%, as shown in Figure 1.

Figure 1: Time vs Temperature
However, the actual performance slightly deviated from the initial prediction, falling short of the anticipated 20-minute reduction in cooling time. This discrepancy between the calculation and measured value may be attributed to physical factors that were unaccounted for in the calculation, such as inconsistencies in insulation quality across different areas of the room, changes in ambient humidity levels, and variations in the efficiency of the cooling system. The tables below contain the validation results of the time portion of the experiment.

Figure 2: Calculation vs Actual Results
The device demonstrated successful airflow adjustment through the manipulation of blades with the linear servo mechanism. Results of shutter angles and their respective airflow showed varying performance. Angles of 60 and 45 degrees yielded successful results, while at 30 degrees, the airflow measurement failed due to unexpected turbulent flow conditions specific to the vent. The smaller angles resulted in a decrease in airflow through the vent, as shown in Figure 2. Even smaller angles caused unreliable readings due to turbulent flow.
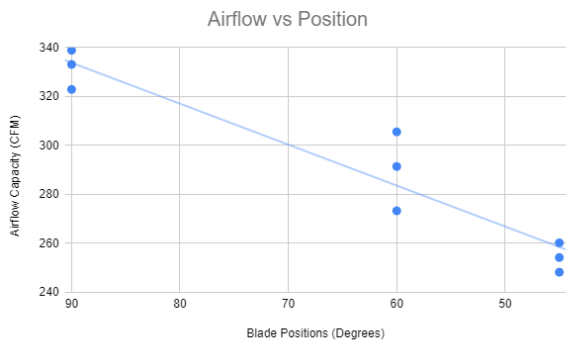
Figure 3: Airflow vs Blade Position
Before the final report, we plan to integrate a PCB board to simplify the electrical wiring essential for the device's functionality and replace the current Arduino Uno with the Arduino Nano being used. The PCB board, solder, soldering iron, and iron are on hand and just need to be soldered.

Figure 4: Soldering Progress
Additionally, we are aiming to enhance the visual appeal of the device by spray painting the exterior casing from green to white. It's worth noting that all necessary validation experiments have been completed at this stage, leaving no further experiments to conduct before the final report. Once the circuit board is added on to the final device, the final changes will be added onto the SolidWorks Model.
Below is where the graph is implemented onto the Rough Draft of Technical Poster on 4/13/2024. The LINK will show the most up to date poster.


Comments